News Dynamics during the COVID-19 Pandemic
I recommend to read this article in light mode, due to all graphics being screenshots with white background. You can switch the current mode in the bottom-left, next to the github icon.
The COVID-19 pandemic has been a global health crisis with profound societal implications, drawing significant attention from the media.
In this post I will present some interesting insights about news during the pandemic in 2020 to 2022. This articles is based on a study project in university, I conducted together with a friend of mine, Florian Kellermann.
In our research, we aggregated news data, including nearly half a million articles published during the pandemic. After extensive data aggregation and preprocessing we focused on analyzing the news dynamics of during the COVID-19 pandemic, including coverage, sentiment, related topics and more.
This blog post provides an overview of some interesting parts of the study, including failures and successes.
Data Collection: Circumventing Google’s Bot Protection
We initially started with a dataset from kaggle, originally made for fine-tuning language models. Unfortunately this dataset was not only incomplete for our use case of analyzing articles, missing data such as dates, publisher and URLs but also faulty, redundant including many articles miscategorized as COVID-19 related. So the only real value this dataset had, was that it gave us article headlines to search and obtain again, including all the needed metadata, which is where the problems started…
Automated Web Searches
Our first approach to scraping data involved automating web searches using a combination of VPNs and masking techniques, to prevent google from blocking our requests too early. The goal was to capture a broad spectrum of news articles across various platforms, by automating google search for the headlines given in the dataset. Simulating different user headers was not enough and google blocked our IP after obtaining around 100 articles.
So we tried cycling through different IPs using Mullvad’s VPN service with a simple script:
1
2
3
4
5
6
7
8
9
10
11
12
13
14
15
16
17
18
#!/bin/bash

server_list=`cat ./mullvad_server_list.txt`
readarray -t servers <<< "$server_list"
shuffled_servers=($(shuf -e "${servers[@]}"))

for server in "${shuffled_servers[@]}"
do
    echo "switching vpn to $server"
    mullvad relay set hostname $server
    mullvad connect
    sleep 5
    python ../src/add_metadata.py -ip $1 -op $2 -s $3 -t 50 -e 100000 -hp $4
    mullvad disconnect
    sleep 5
done

exit 0
Et voilà, it worked. At least kind of, as the speed of scraping diminished over time. Even though we parallelized everything we had to add artificial delays to scrape longer without google blocking our requests.
Web Search with SerpAPI
Recognizing the limitations of our initial approach, we switched to using a google search API (SerpAPI), which they kindly allowed us to use for free for our research project. Equipped with one million available API requests, we were finally able to scrape all the missing metadata, allowing for better analysis.
Data Preprocessing
Once the data was collected, the next step was cleaning it to ensure accuracy and consistency. This process involved several key stages:
- Exploratory Data Analysis: We conducted basic analysis on the raw and preprocessed data noticing relevant problems and properties of the data.
- Removing Duplicates: We identified and removed duplicate entries to prevent skewed results.
- Filtering Languages: Especially in the context of natural language processing (NLP) we wanted to keep our data monolingual, removing non-english content.
- Standardizing Data: We standardized date formats, removed HTML and scraping artefacts, and normalized text for analysis.
- Filtering Relevant Content: We filtered out irrelevant articles that did not pertain to COVID-19.
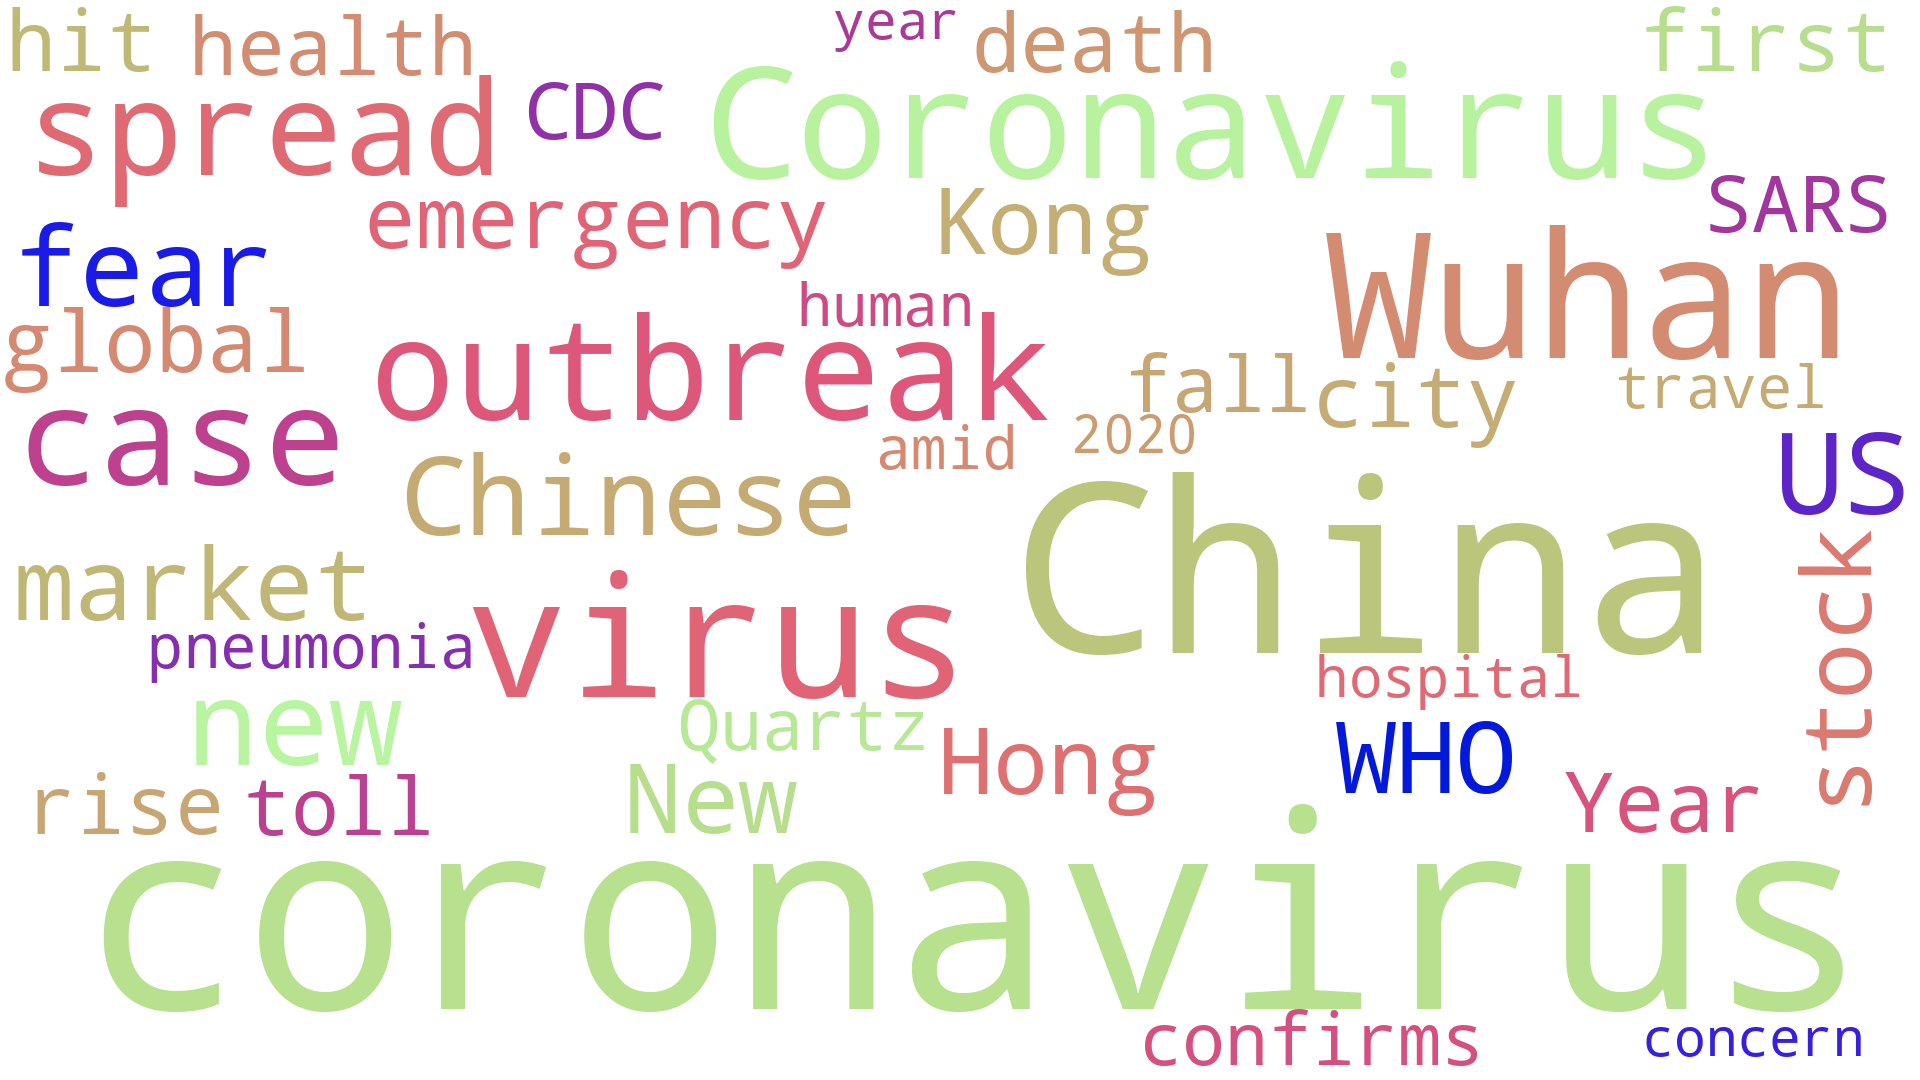
Our method 5. to filter out irrelevant articles is overlapping with analysis, as we used keyword filters obtained from cherry-picked topic clusters we constructed using Latent Dirichlet Allocation (LDA). LDA is a bayesian modeling algorithm, especially useful for discovering topic clusters in text-document collections. To enable effective topic modeling, we first used NLP techniques for normalization, such as stopword removal and stemming (lemmatization was to compute-heavy).
We then ran Multicore LDA on the articles and obtained the following clusters, projected into 2D using Multidimensional Scaling (MDS). We clustered into 30 topics, ranked by their share in the whole dataset. Each cluster contains its related words, ranked by salience \(s\), which is simply the probability of the word times its distinctiveness \(d\).
\[s(w) = P(w) \times d(w)\]where distinctiveness \(d\) is defined as summing over all topics \(T\) the logarithm of the probability of a topic given the word divided by the general probability (share) of a topic:
\[d(w) = \sum_{T} P(T|w) \log \frac{P(T|w)}{P(T)}\]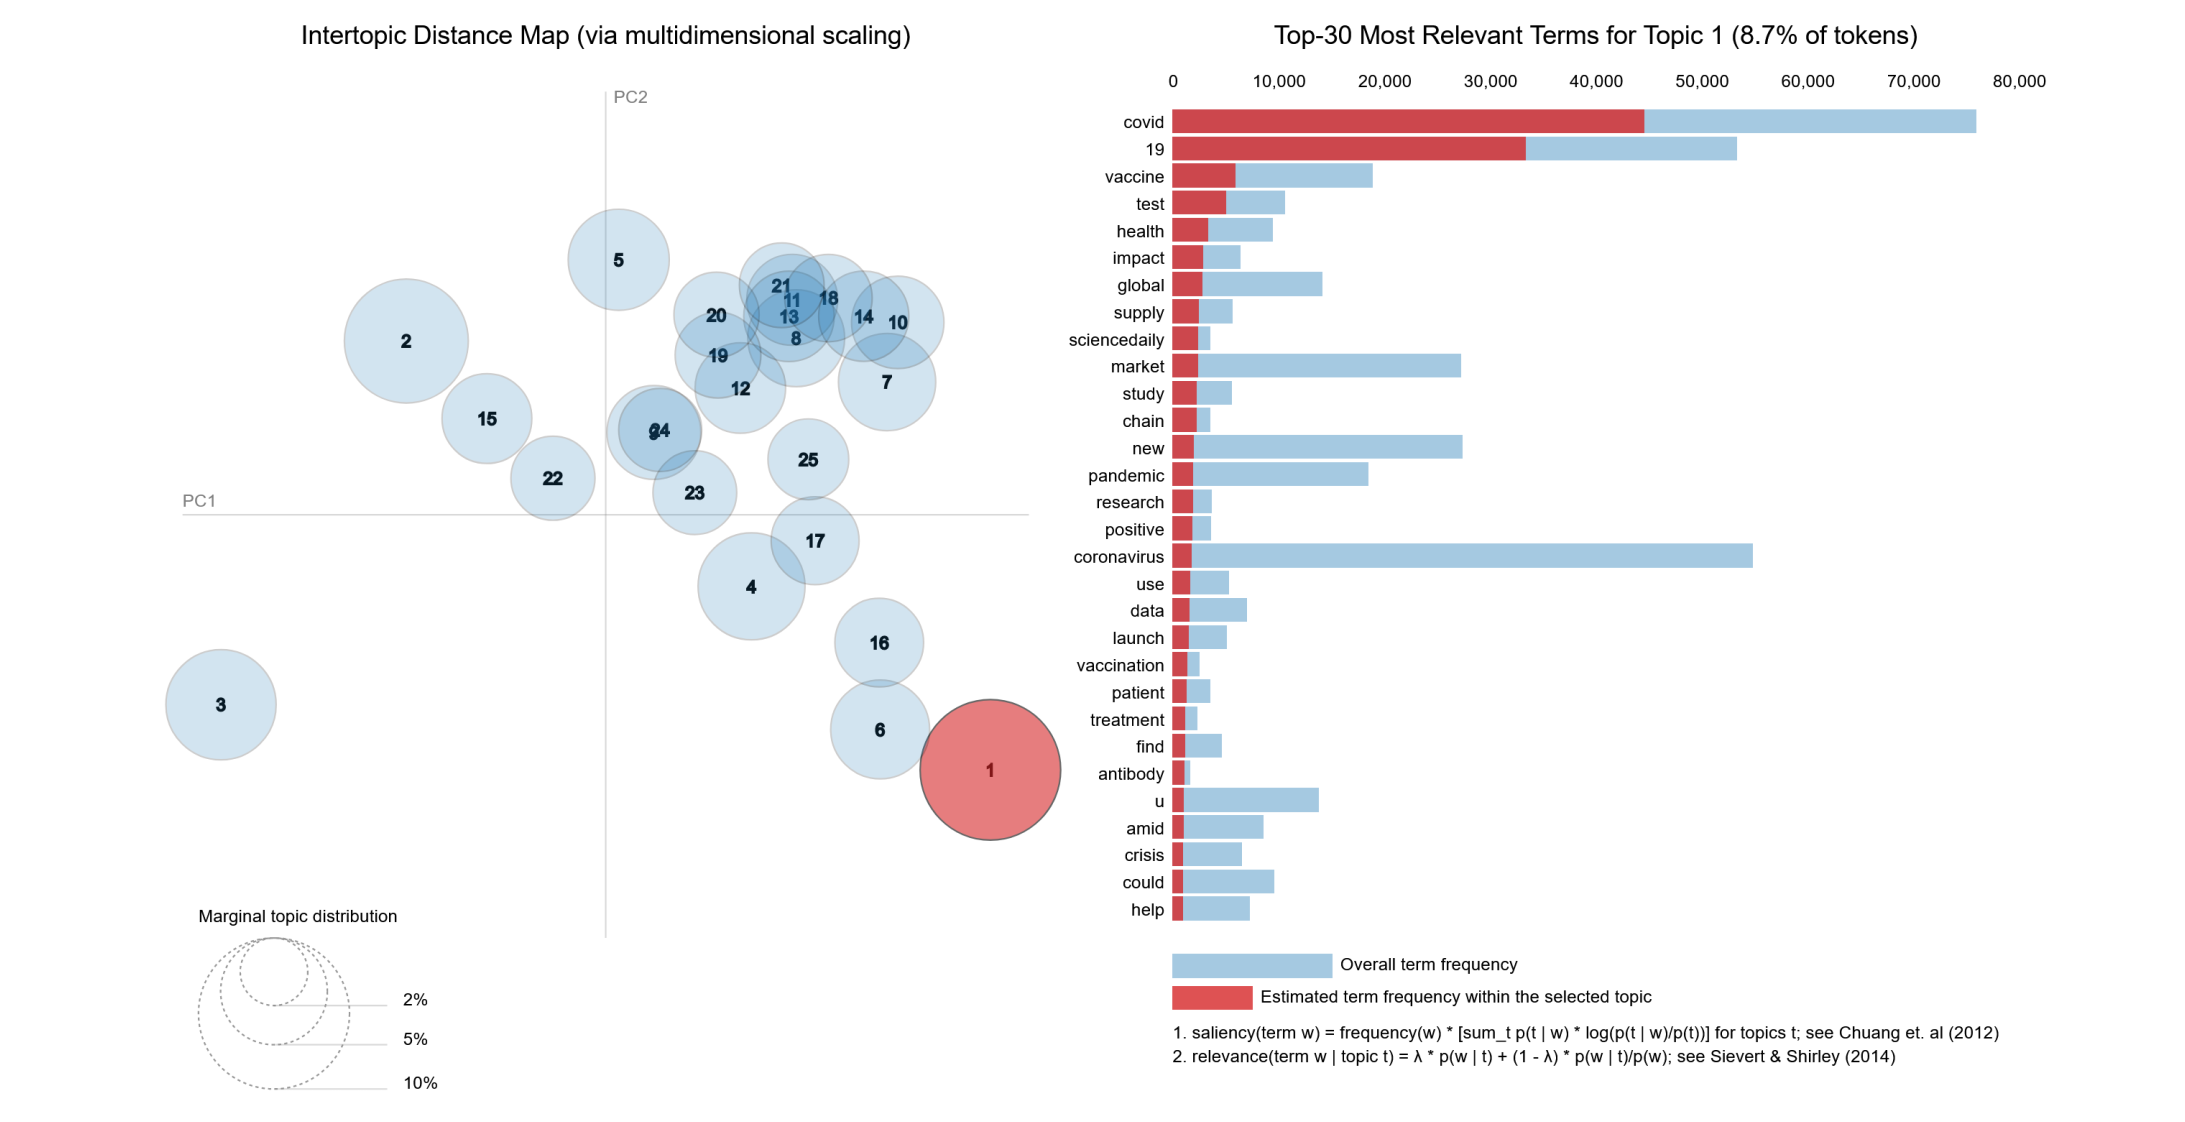 LDA topic clusters, the prominent and distinct COVID-19 cluster with a 8.7% share, marked in red
Cherry picking the most relevant words in the Clusters related to COVID-19 allowed us to built an well-informed keyword filter and to determine the focus on COVID-19 in the news dataset, which was rather low, with only 36.4% articles mentioning our COVID-19 related keywords.
Analysis and Results
When conducting an Exploratory Data Analyis (EDA) we found some basic patterns in the article data. Our news articles where scraped relatively even from different publishers:
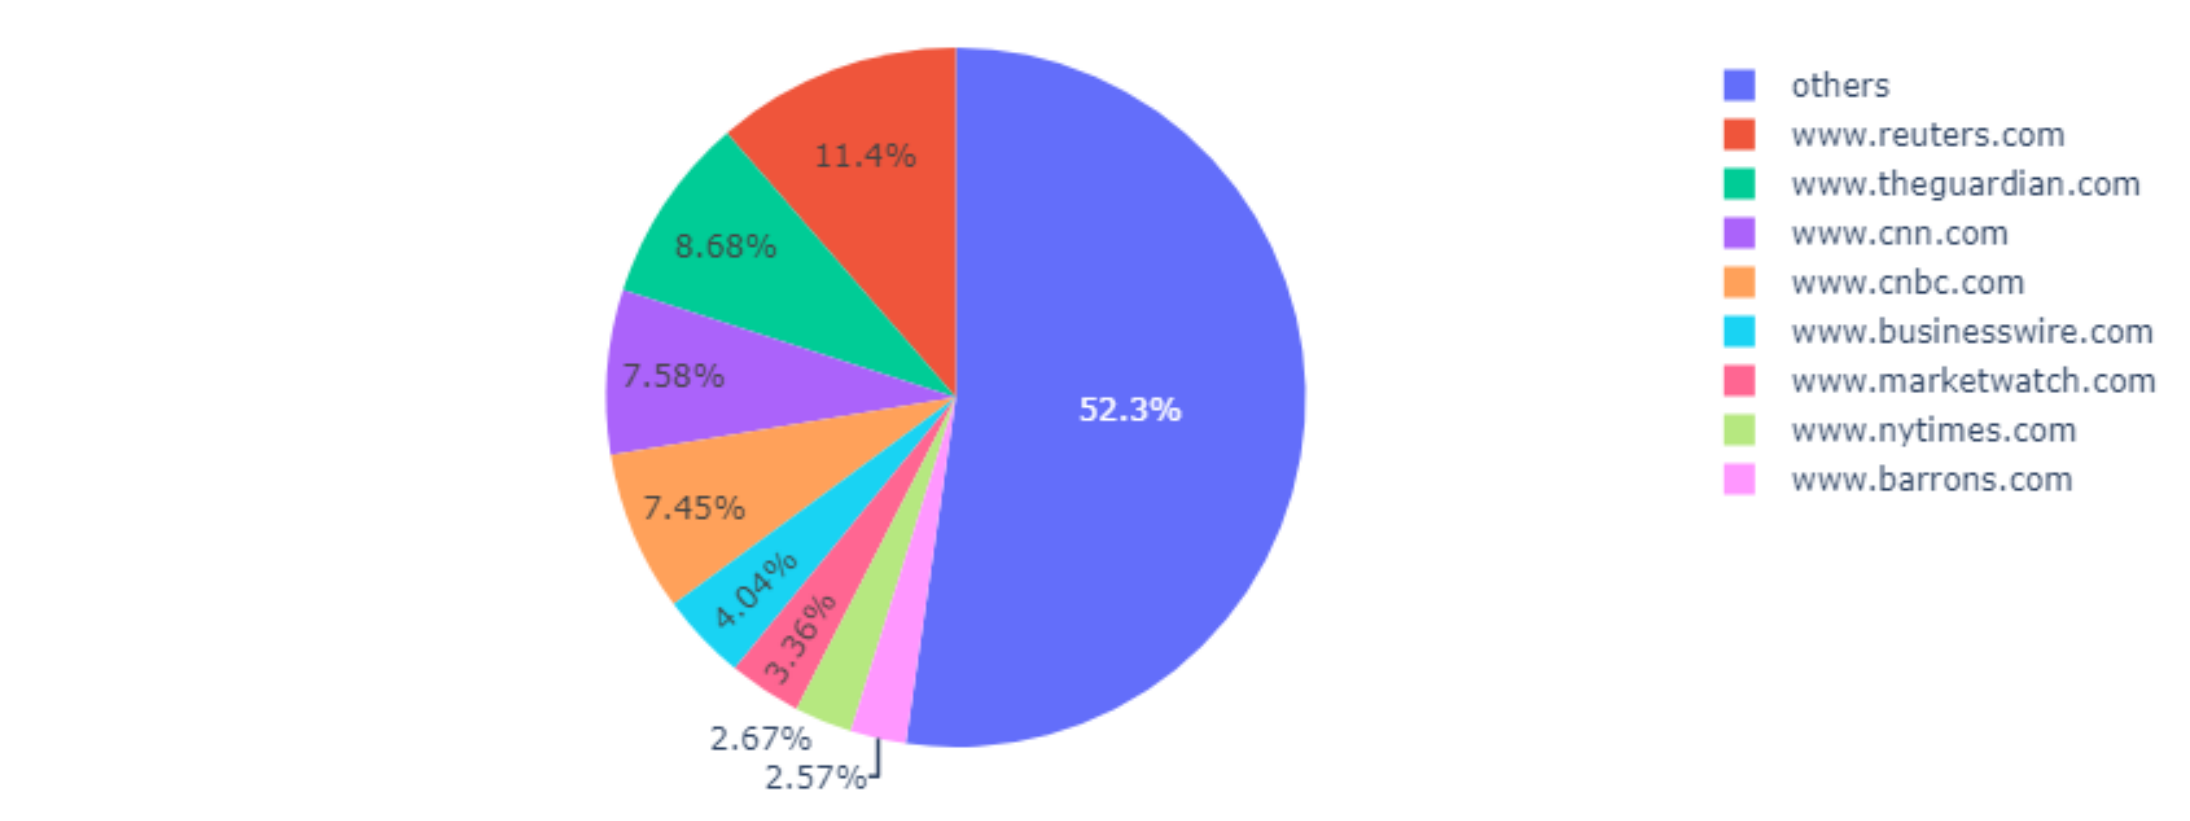 Biggest news sources plotted by COVID-19 articles (categorized as “others” if <5000 articles of the publisher in the dataset)
Considering the length of the news, most of them were distributed around 350-700 words. Expected weekday-related publishing patterns were clearly visible, with less articles published on the weekend. The number of news articles published in 2020-2022 related to COVID-19, had a clear spike in the first months of the pandemic until it started to idle around October 2020, with a clear drop around March 2022.
With cleaned data in hand, we conducted a detailed analysis, by starting to correlate articles published to different COVID-19 metrics.
Non-correlating metrics
We suspected some metrics to correlate over time with the rate of articles published, but were mostly unable to find significant correlations, having predictive value. We gathered the metrics data from official datasets like the OWID Dataset. For an interactive view and exploration of the COVID-19 data, consider visiting their interactive explorer.
- COVID-19 articles and number of cases \(\rightarrow\) no significant correlation
- COVID-19 articles and number of deaths \(\rightarrow\) no significant correlation
- COVID-19 articles in news and vaccinations \(\rightarrow\) no significant correlation
Where correlations were found
While many base metrics did not correlate over time with the publication of news articles, we detected weak correlation in articles specifically related to vaccination and US vaccination rates:
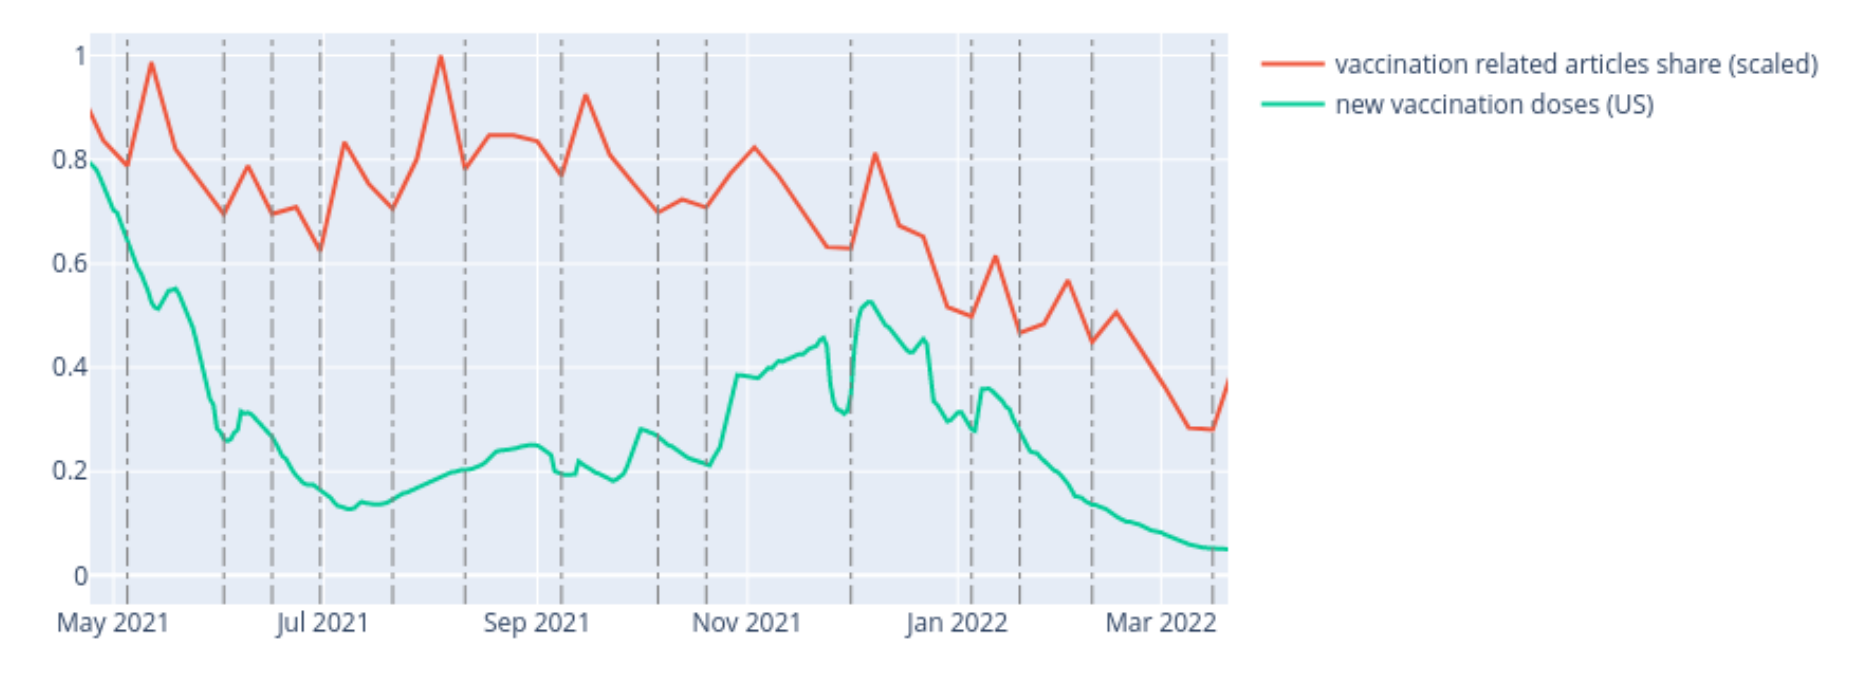 Correlation in spikes and drops between vaccination news and vaccination (In relative scale on y-axis for easier visibility)
Furthermore an interesting observation was the relation of COVID-19 related articles published to the phases of adaption to COVID-19, proposed by the epidemiologist Katelyn Jetelina here.
- Scramble: In early 2020, COVID-19 reached the United States, and due to an underfunded public health system, the country scrambled to respond. Epidemiologists, public health officials, and data scientists struggled to gather information, develop tests, and communicate the risks of the virus.
- Learn: In June 2020, cases seemed to decline, but a lack of coordinated response led to another surge in July. Health departments expanded testing, tracing, and surveillance. Researchers studied the virus, its transmission, and effective protective measures.
- Respond: Winter 2020 brought a spike in cases due to pandemic fatigue and holiday travel. However, vaccines with high effectiveness became available, providing hope. Despite the vaccines, the fight against disinformation and the emergence of new COVID-19 variants continued.
- Test: In early summer 2021, the US experienced a low in COVID-19 cases. However, the delta variant, which was more transmissible and severe, caused another wave of cases, pushing the US response to its limits. This phase tested the capacity of the health care system, the resilience of public health workers, and the public’s patience.
- Hope: Despite the ongoing challenges, there is optimism that the epidemic curve will eventually come down. However, the pandemic’s aftermath will still need to be addressed, as it has left a lasting impact on families, friendships, employment, and the mental health of frontline workers. The amount of COVID-19 instances declines, then plateaus, and people begin to live with the virus.
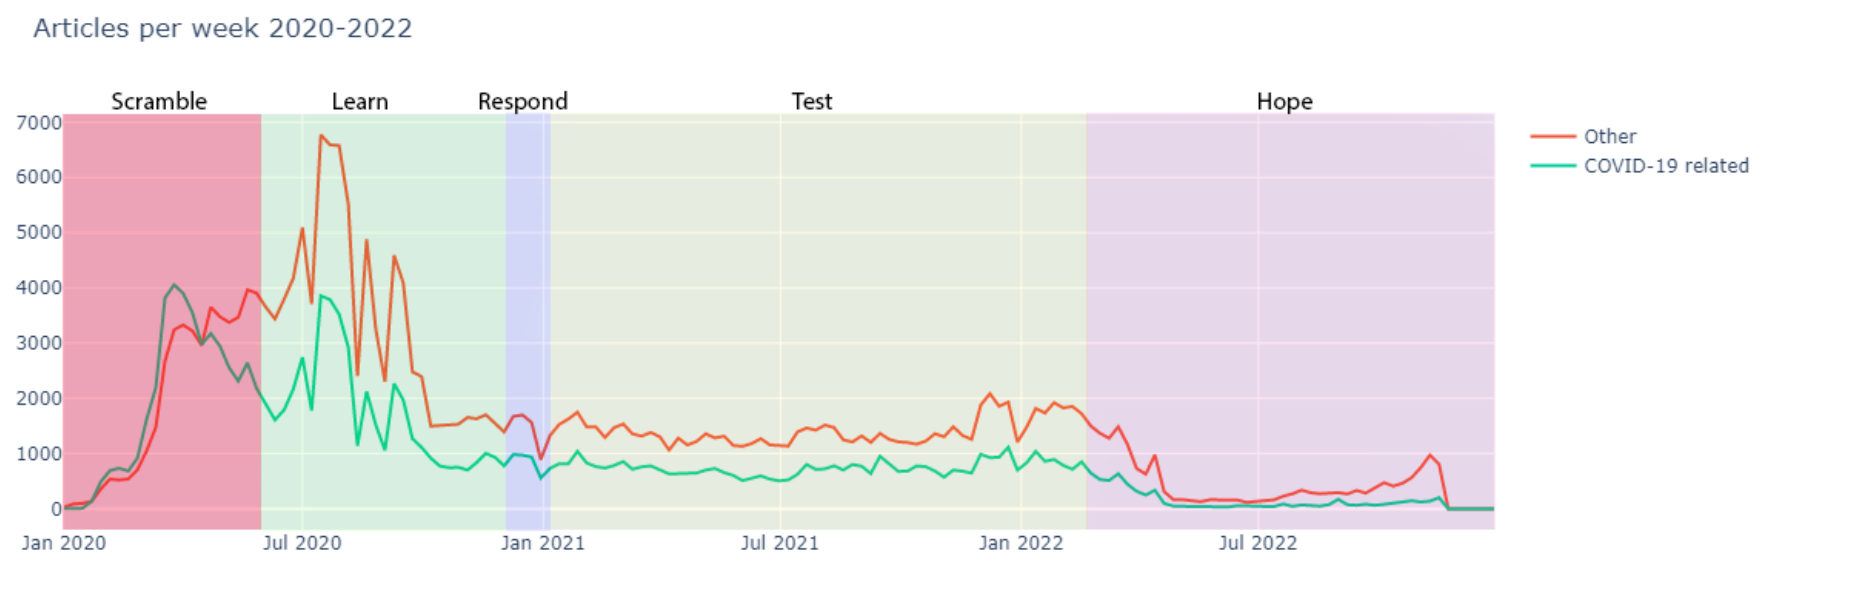 Response phases in relation to the number of articles published per week
Sentiment of the Different News Sources
Next to correlating metrics, we were interested in analyzing the sentiment of publishers in articles published during the pandemic. For evaluating the sentiment of text, we used the nltk.sentiment module of the Natural Language Toolkit (NLTK). General sentiment is a value between -1 (negative) and 1 (positive), with 0 being neutral.
On average the news titles were perfectly neutral, but considering the variance the boxplots showed high variance, with many articles being strongly positive or negative. This aligns with the intuition, that news publisher attract more readers over when stirring up their emotions. On the other hand the content was more evenly distributed with a neutral, but slightly positive sentiment of 0.05 on average and less variance (likely due to higher text length).
In the articles over time, the average sentiment scores stayed similar. However comparing the sentiment of different news sources, shows clear differences, correlating with their field of focus (e.g. business vs. general):
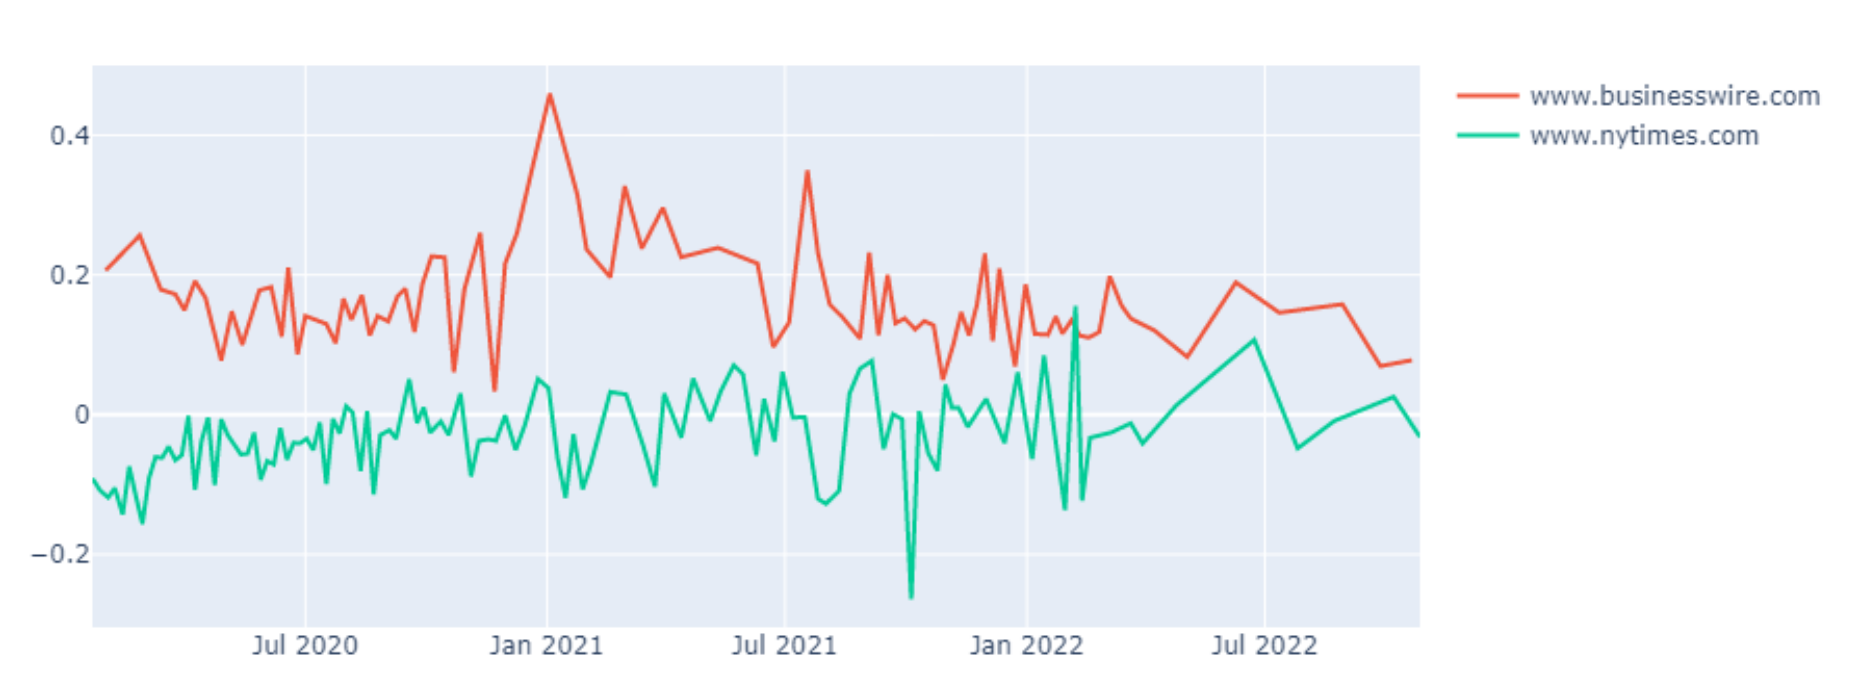 Business related news tend to have a more positive sentiment in COVID-19 articles, compared to general news sources such as the New York Times, which stayed moderately neutral
To analyze the sentiment of Business Wire further, we also tried to correlate its sentiment with the movements of economic indices like the Dow Jones Industrial Average, but no clear correlation was found here. I suspect that the positive sentiment is explained by exploiting the reader’s psychological tendencies, being especially attracted to read articles discussing potential investment chances, rather than COVID’s already known negative impact on the worldwide economy.
Key Takeaways
For this analysis some assumptions had to be made, after gathering all the data based on the initial kaggle dataset, we detected that most articles were not linked to COVID-19 and cleaned the dataset further. For meaningful insights we assumed that the data in the dataset was scraped in even time intervals from the sources, as claimed on kaggle by the author of the initial dataset.
The analysis of news dynamics during the COVID-19 pandemic yields several interesting insights:
- Correlation with COVID-19 Metrics: There was no significant correlation between the number of COVID-19 articles published and the number of cases or deaths. This suggests that news coverage was not directly driven by the severity of the pandemic in terms of health metrics but possibly by other factors such as public interest, political events, or new information about the virus.
- Vaccination Correlation: A weak but notable correlation was found between the frequency of vaccination-related articles and vaccination rates in the US. This suggests that news coverage on vaccinations may have influenced or reflected public engagement with vaccination programs.
- Phases of Pandemic Response: In the analysis, we also aligned the phases of COVID-19 adaptation (Scramble, Learn, Respond, Test, Hope) with news article frequency. This alignment indicates that media coverage adapted to different stages of the pandemic, reflecting shifts in public health focus and societal responses.
- Sentiment Analysis: Sentiment analysis revealed that while headlines were generally neutral, the content of articles was slightly positive on average. Variations in sentiment across different publishers suggested that business-related news tended to be more positive, likely to attract readers interested in economic opportunities.
Critique
We did the project, partially presented in this post, during our second and last year in our Bachelor’s (which is a while ago). While summing up some of the work here, I found many things I would do differently now.
First of all, I doubt the validity of the kaggle dataset for our purpose. Since we had to build up the whole dataset again, including metadata, it would have been better to directly scrape the news data during the pandemic from selected sources, without just relying on the articles in the initial dataset. This way, we would have ensured that we get all COVID-19 related articles during this time period without any unknown bias.
Furthermore, I would use more expressive plots for many parts of the analysis. For example, alongside standard box plots, heatmaps would have been a good addition to visualize sentiment differences among publishers. Additionally, sentiment differences could be better represented using a combination of sentiment polarity line charts and stacked bar charts to display the distribution of sentiments across different time periods.
In extension it would be interesting to include some strongly opinionated (low-quality) news sources for comparison in the sentiment analysis and to regard more nuanced valence dimensionalities (e.g. fear/panic or hope) with better sentiment models.
If you are interested in the implementation, feel free to request access to the GitHub repository or to the underlying paper via mail or LinkedIn.